The first step when creating a NetLogoLab model is to add the extensions keyword to NetLogo's Code tab. Just go to the Code tab and add this line:
extensions [gogo]
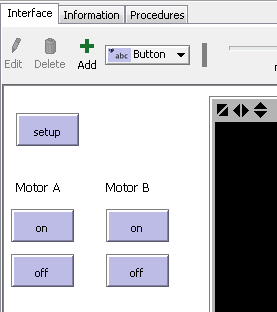
Now let's start the model. Imagine that we want to control a car with four wheels and two motors attached to the back wheels. We will assume that you have built such as car and connected the motors to the output ports "a" and "b" on the GoGo board. One very simple approach could be to create two buttons for each motor, "on" and "off":
The code associated with these buttons is very simple: for the "on" button, we could simply have
gogo:talk-to-output-ports ["a"]
gogo:output-port-on

For the off button, it would be very similar:

gogo:talk-to-output-ports ["a"]
gogo:output-port-off
The other set of "on" and "off" buttons, used to control the second motor, would have very similar code, except that we would use the second output port ("b"), so:
gogo:talk-to-output-ports ["b"]
We could make our model more interesting by adding a "toggle direction" button, adding a button with the following code, which would reverse the direction of motors "a" and "b":
gogo:talk-to-output-ports ["a" "b"]
gogo:output-port-reverse
To create a simple sensing project, we will assume that you have added the GoGo extension to your model and successfully opened a connection to the GoGo board, i.e., adding the "extensions" command to the Code Tab. For this sensing project we do not need motors, but we will need another device: a temperature sensor. A standard GoGo board comes with a temperature sensor. It is labeled (TEMP Sensor). More info on the sensors that come standard with a gogo board can be found in the GoGo Docs. The simplest use of a temperature sensor, obviously, is to display the temperature. We could achieve this by plugging the sensor in to input 1 and adding a monitor to the NetLogo interface with this code:
gogo:read-sensor 1
The GoGo docs say, "Note that the readout is not in Celsius or Fahrenheit. The value is reflects the resistance of the sensor. Mappings between the resistance and the standard units must be done manually." So, to figure out how these values map to a real temperature, you will need to use a thermometer and see how the reading on the temperature sensor corresponds to the temperature in degrees. If you found out that the conversion is to divide by 30, the monitor on the NetLogo interface could be changed to:
gogo:read-sensor 1 / 30
The sensor value could also be used to control on-screen objects, such as turtles. For example, let us create two buttons: a "create one turtle" button, which will clear the world and create a turtle, and a "move with heat" button, that will cause the turtle to move forwards depending on the temperature reading from the sensor. The code would look like this:
to create-one-turtle
  clear-all
  create-turtle
end

to move-with-heat
  if gogo:read-sensor 1 > 500
    [ forward 1 ]
end
If the "move with heat" forever button is activated and the user heats up the sensor (by rubbing it, or slowly bringing a flame near it), the heat threshold will be achieved (> 500) and the turtle will move.
A more elaborate use of this sensor apparatus would be to control output devices, such as motors. The user could, for example, turn a motor on when the value from the temperature sensor reaches 500, using the following code:
to turn-motor-on-with-heat
  if gogo:read-sensor 1 > 500
  [
    gogo:talk-to-output-ports ["a"]
    gogo:output-port-on
  ]
end
Another possible use of the sensing primitives is to plot and log data. Logging could be useful for more elaborate data analysis and comparison, and can be achieved with NetLogo's list commands. For example, if the user wants to log sensor values from sensor 1 every 0.5 seconds, the code could look like this:
to log-data-from-sensor
  set data-vector lput (gogo:read-sensor 1) data-vector
  wait 0.5
end
Finally, plotting data is straightforward. The following code, for example, would create a graph for the value of sensor 1:
plot (gogo:read-sensor 1)